Chapter 5 Results
As a result of our project, we were able to find out that the number of people of color nominated for Oscars Best Actor and Best Supporting Actor has significantly increased over the years. The rate of the increase has accelerated towards recent years, and the diversity has also improved. We also found out that the movies with female lead roles take up only 17% of all-time Oscars Best Picture winners, and they are not necessarily as popular as the nominees with male lead roles. It is true that there were 8 cases during the first 50 years (1927 - around 1980) and 8 more during 25 years afterwards (1981-2005), but there were no such case after 2005 until now.
5.1 Popular movies vs Oscar Winners
The box office earnings of Oscar Best Picture have always been lower than the highest grossing movies. Whereas the box office of highest grossing movie has been increasing over the years, that for Oscar Best Picture stayed about the same over the years. In fact, the graph shows that the difference in the earnings has been increasing significantly, indicating that being critically acclaimed by bagging the Oscars Best Picture does not necessarily reflects the popularity of the movie.
5.2 Total Nominations and Wins of actors
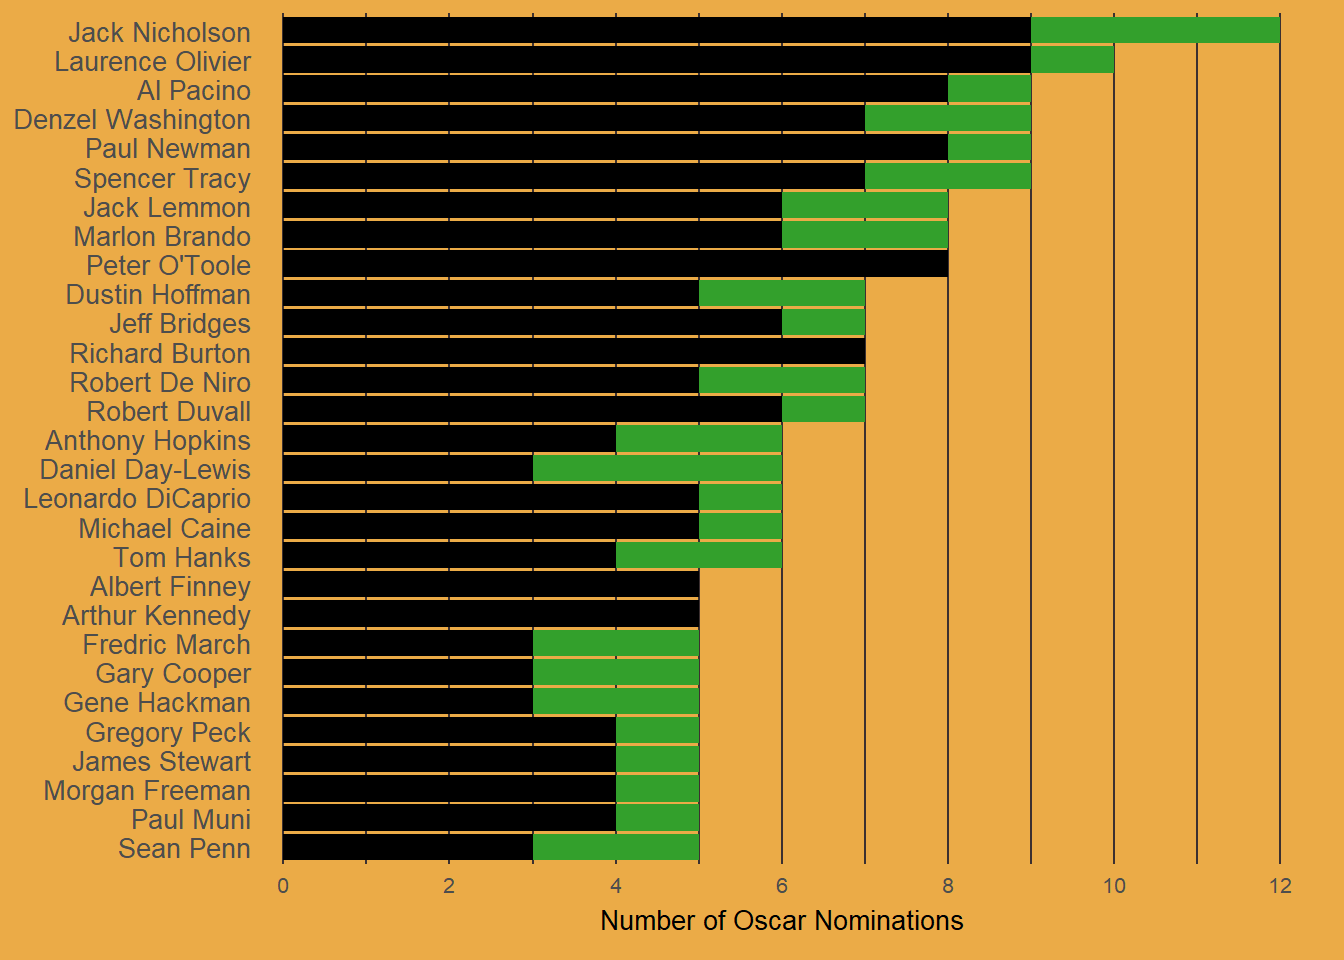
This is a barchart of actors who have been nominated for Best Actor and/or Best Supporting Actor more than four times, and the number of actual wins were colored differently. We can verify that most of them won the award at least once, and there seems to be a positive correlation between the number of nominations and the number of wins. The highest number of times an actor has won the award is 3, which was Jack Nicholson, and he also had the highest number of nominations. We have heard of almost everyone on this list, indicating the reputation of Oscars.
5.3 Total Nominations and Wins of actresses
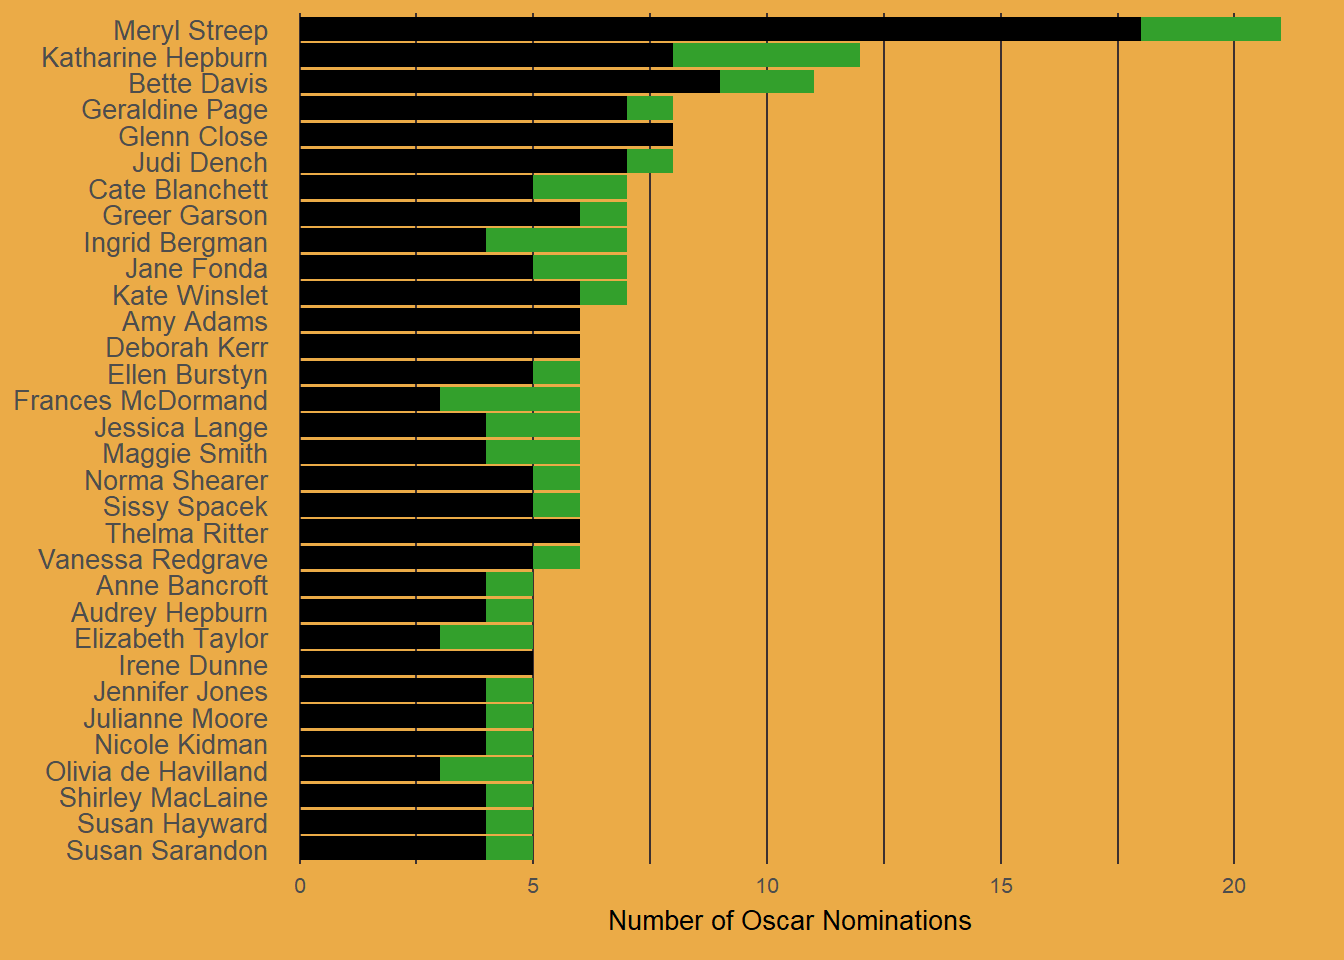
This is a barchart of actresses who have been nominated for Best Actress and/or Best Supporting Actress more than four times, and the number of actual wins were colored differently. There are more actresses than actors of such case. Just lie the previous graph, we can see that most of them won the award at least once, and there seems to be a positive correlation between the number of nominations and the number of wins. The highest number of times an actor has won the award is 4, which was Katherine Hepburn, and she does not have the highest number of nominations. The one with the highest number of nominations is Meryl Streep, and she has won the award 3 times.
5.4 Female-lead Movie Box Office vs Other Nominees that Year
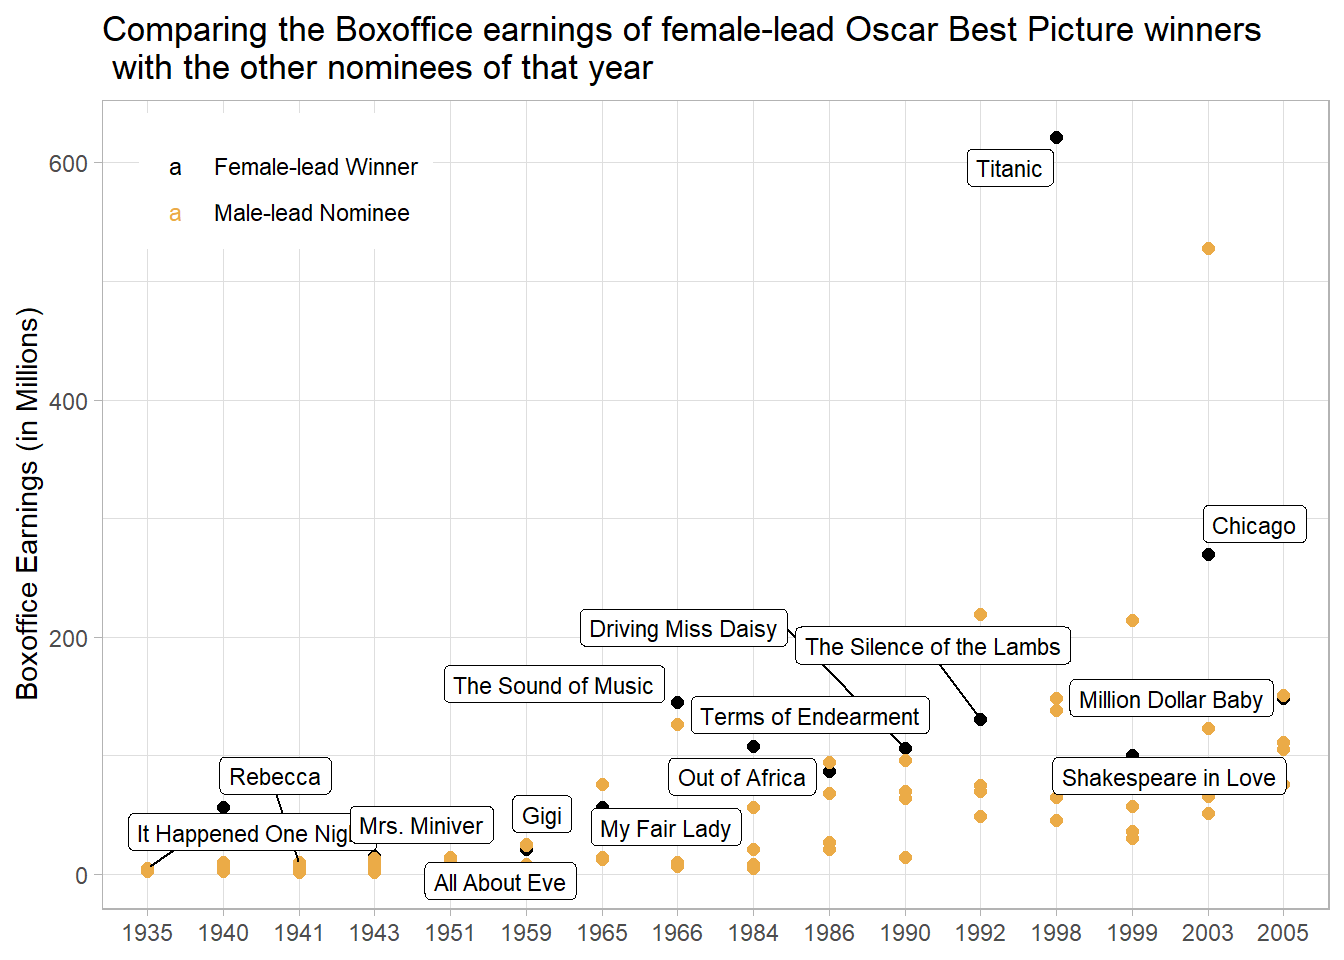
In the history of Oscars from 1927 to 2021, there were only 16 years where movies with female lead role won the Best Picture. We compared the box office earnings of the wins and other nominees which are movies with male leads that year. The range of the earnings has been increasing over the years, and there were just a few years where the female-lead winners had the highest earnings among the nominated movies. The graph shows that Oscars winners with female leads are not necessarily more popular than the nominees of the same years.
5.5 Average Rating of Oscar Nominees over Time
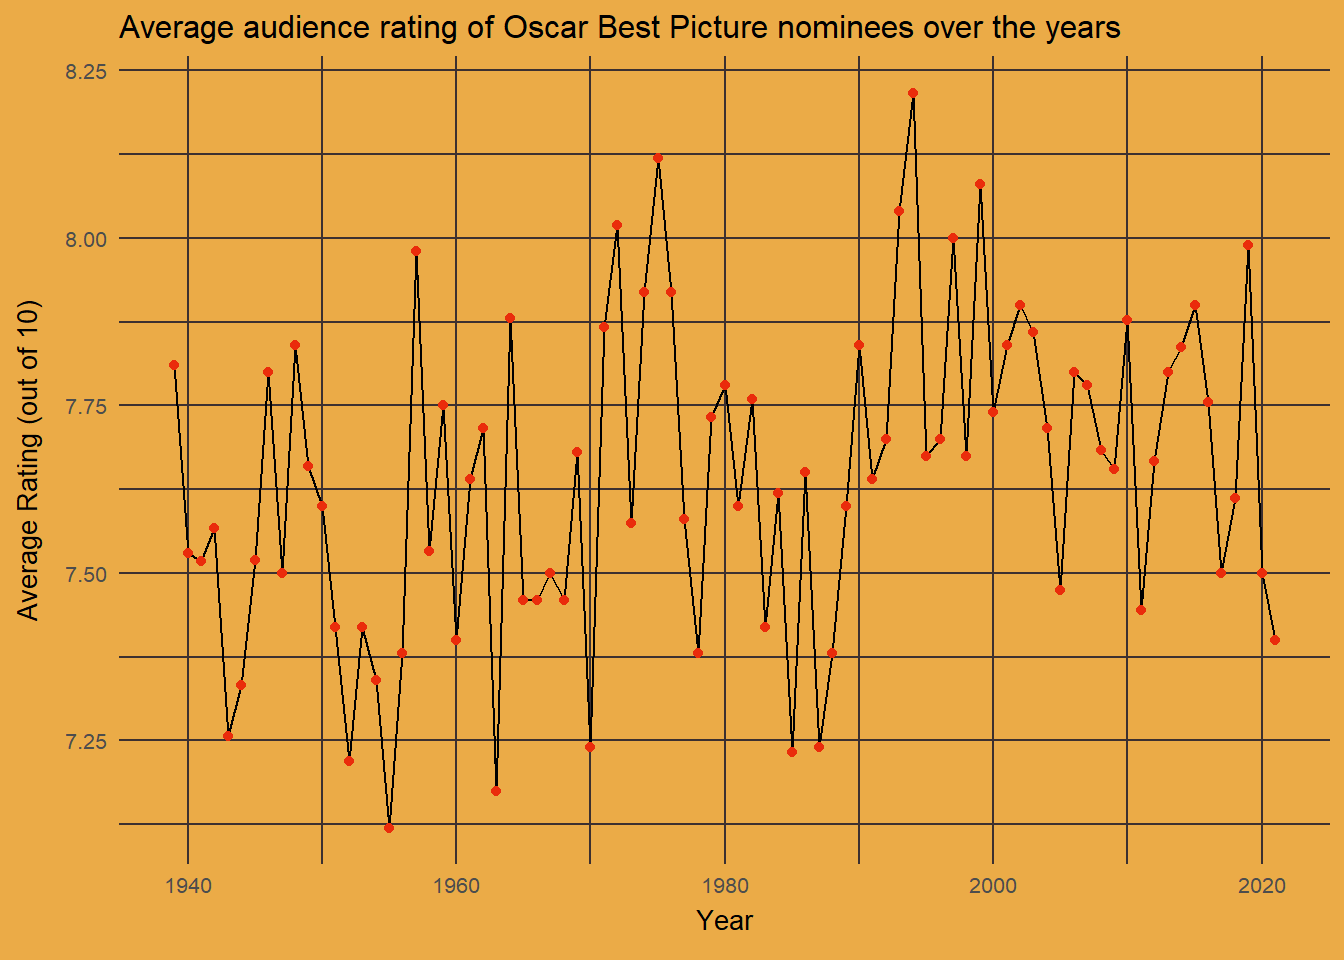
Over the years, there has been a slight increasing trend in the average rating of Oscar nominees. The ratings range mostly from 7.25 to 8, and there seems to be less variance for more recent years.
5.6 Average Runtime of Oscar Nominees over Time
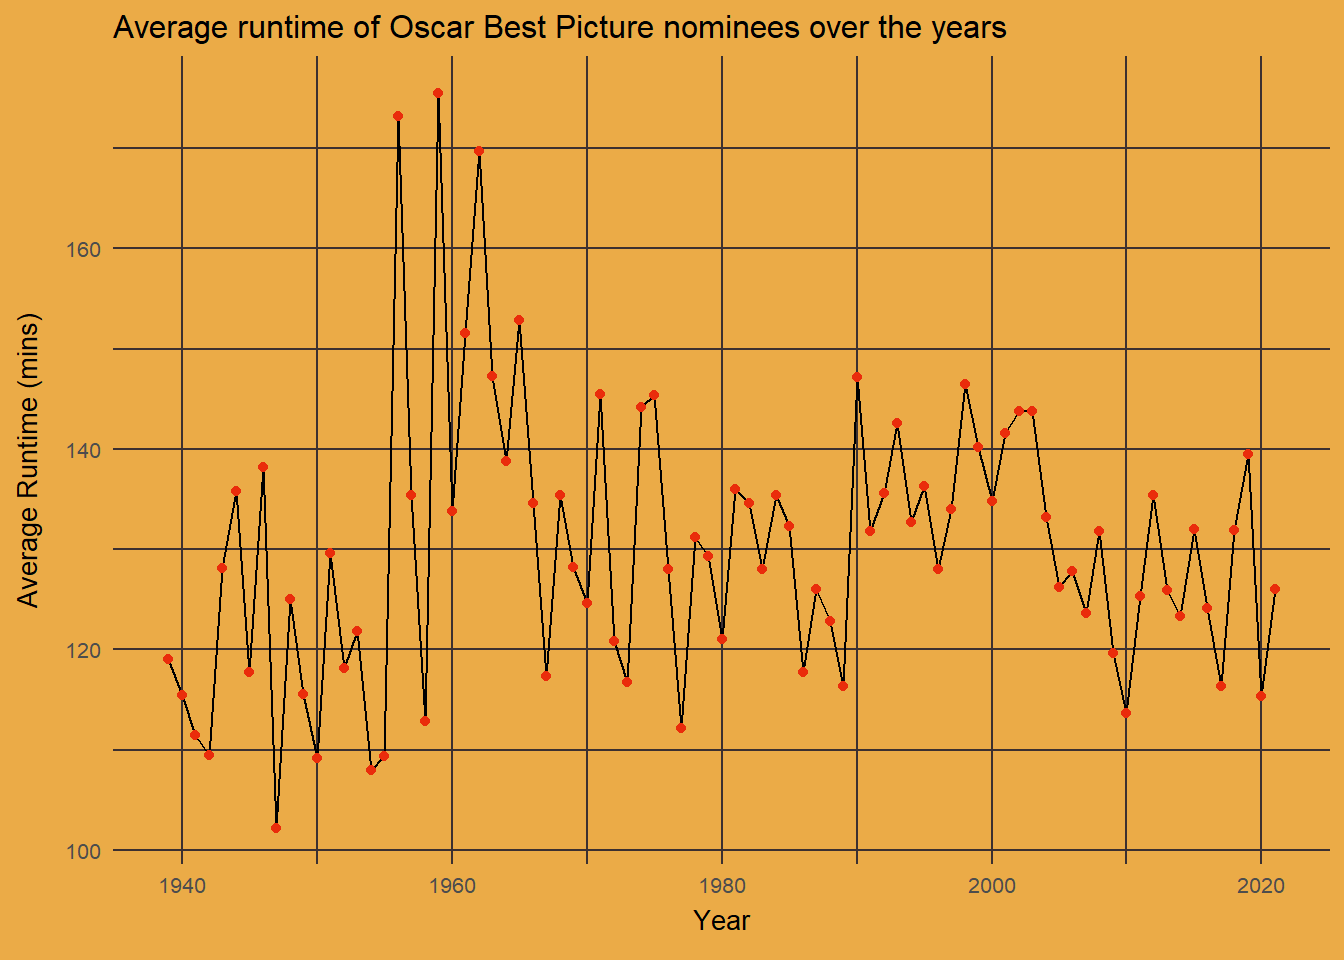
Over the years, there has been a slight increasing trend in the average runtime of Oscar nominees. The average runtime of Oscar nominees range mostly from 110 to 150 minutes. There was a period from mid 1950s to mid 1960s where the runtime of Oscar movies were the highest, almost near 180 minutes.
5.7 Average Runtime vs Rating of Oscar Best Picture Nominees
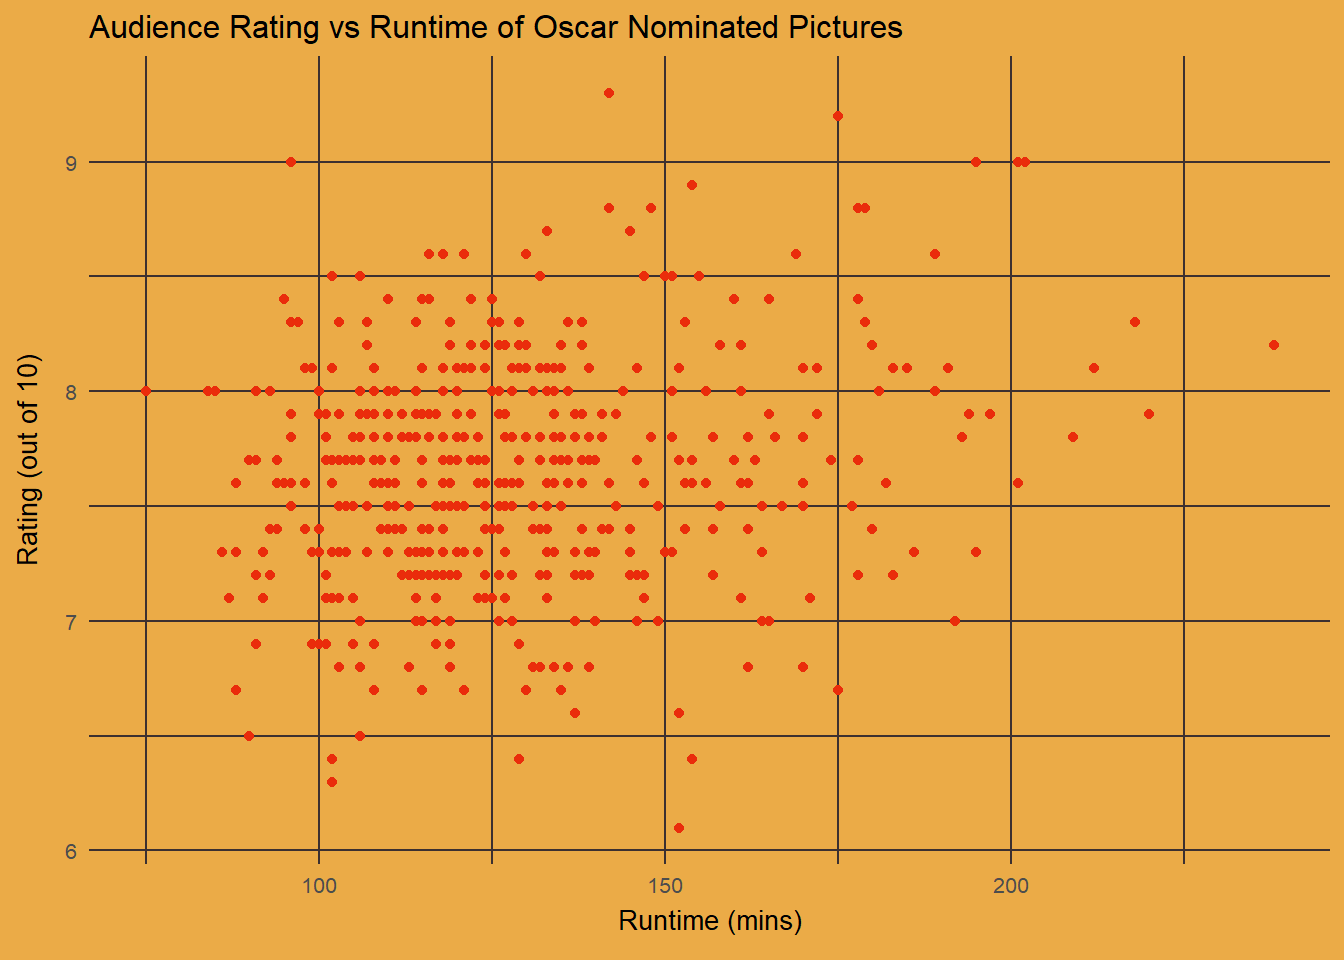
We can see that a large proportion of the Oscar movies have runtime of 100 to 150 minutes and ratings of 7 to 8.5. There are just a few movies with ratings over 9 and below 6.5, or runtime over 150 minutes. There is not necessarily a correlation between runtime and ratings.
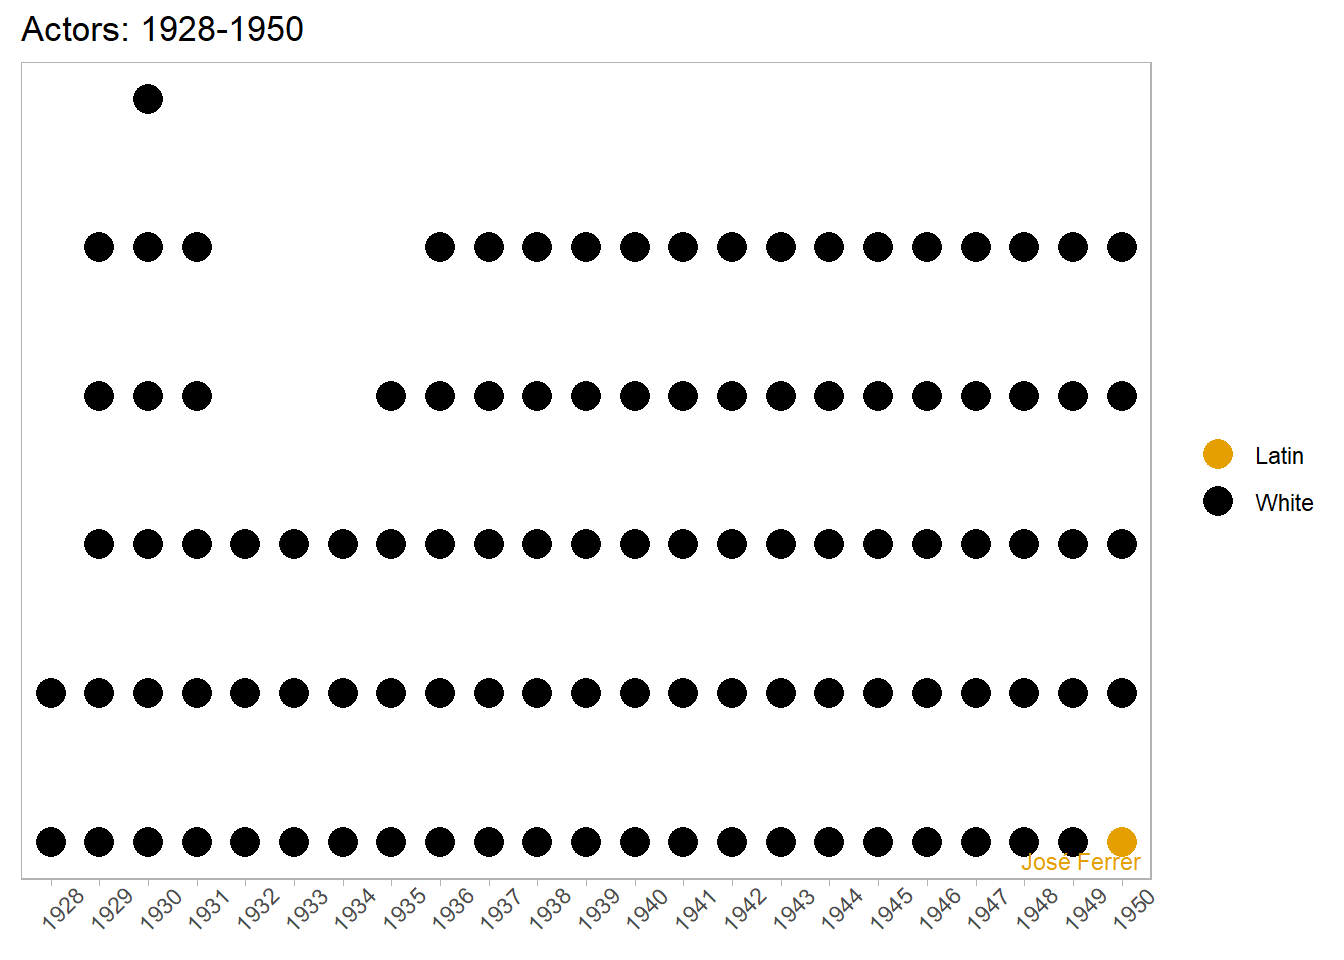
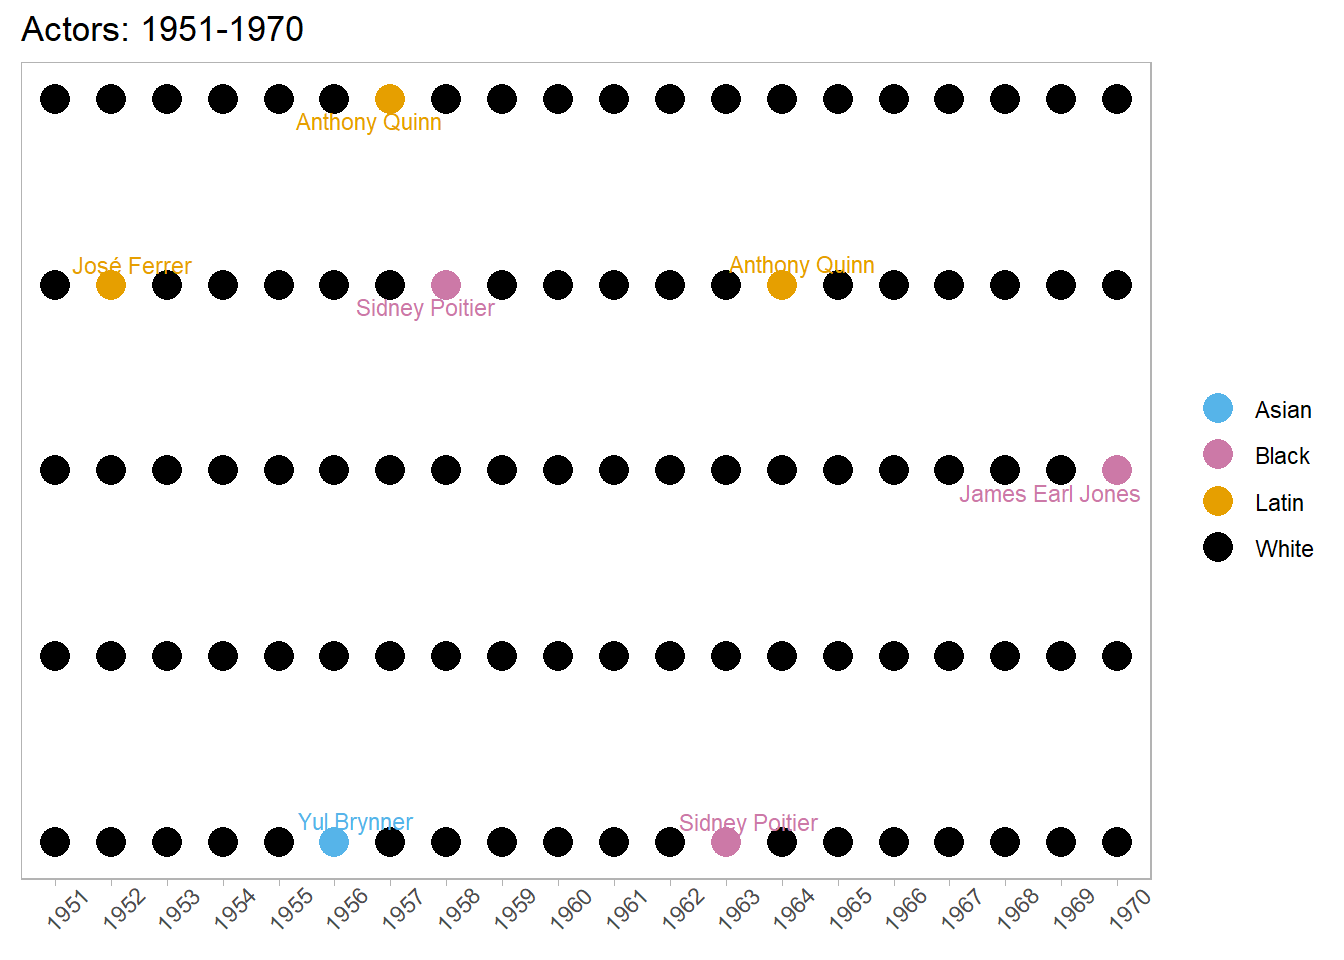
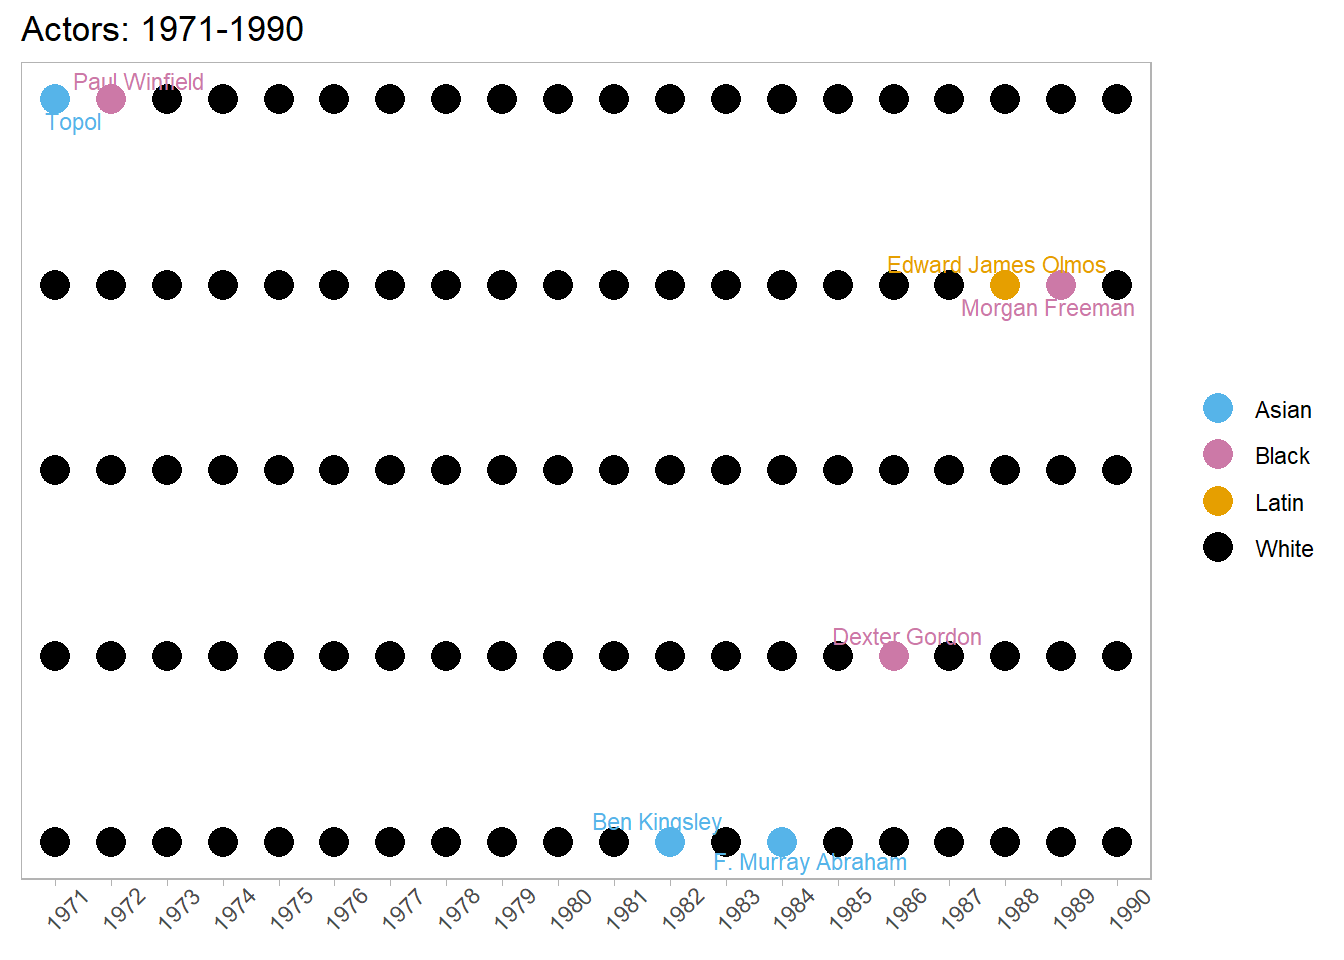
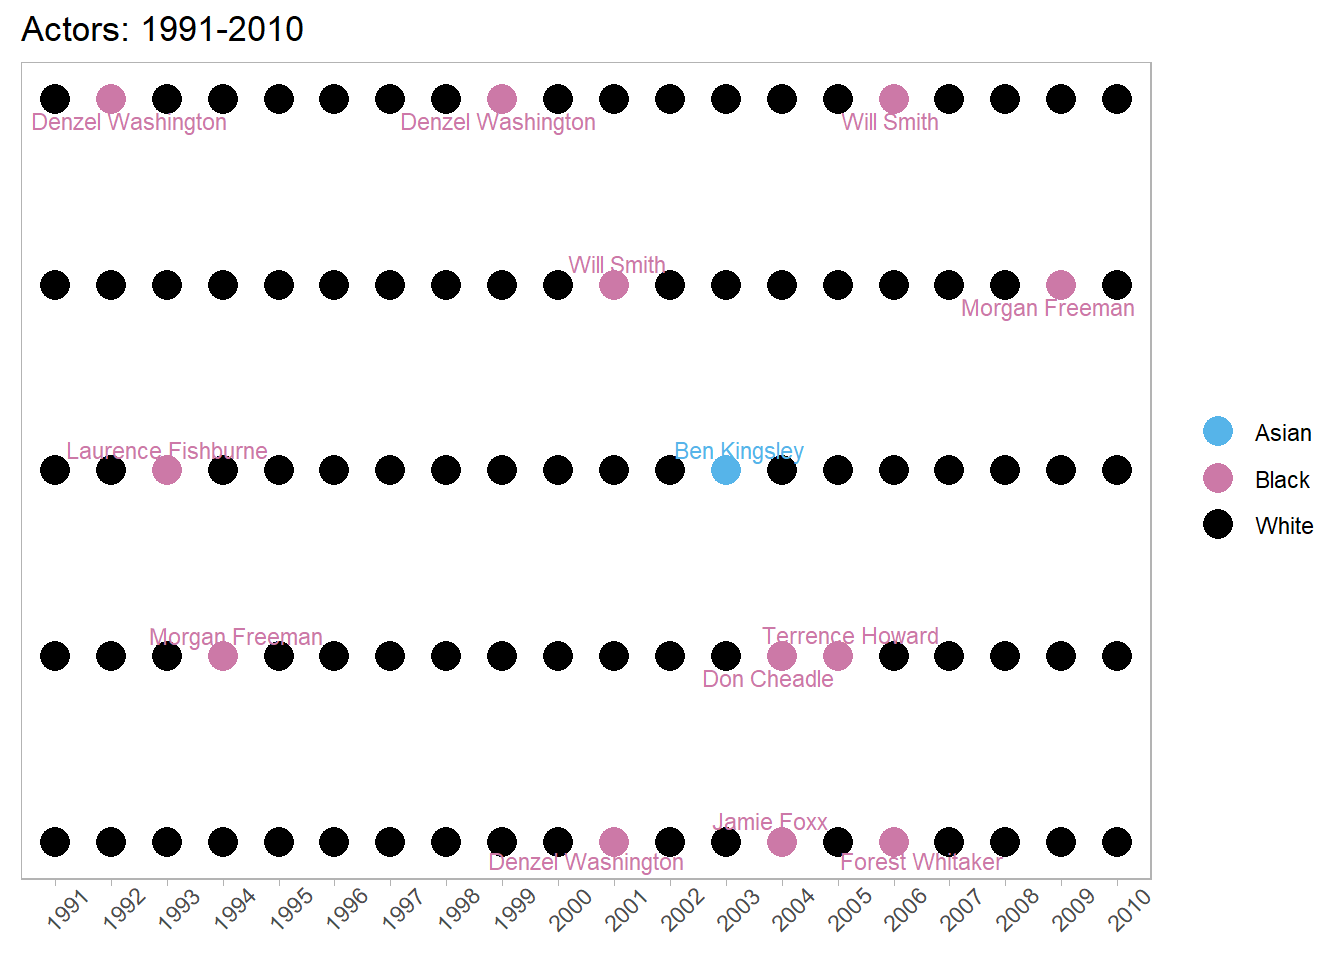
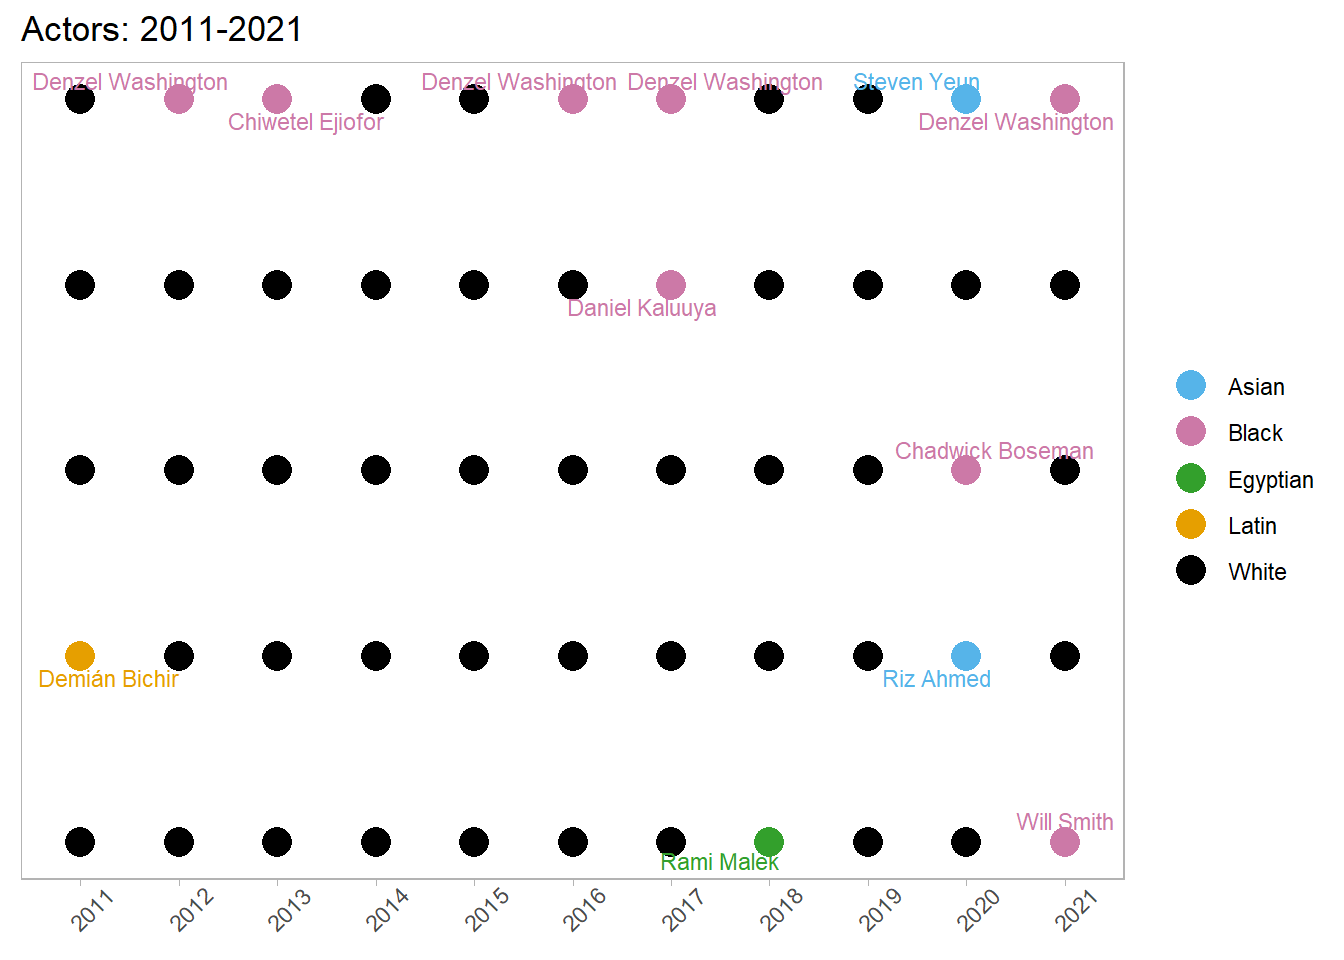
5.8 Best Lead Actors Race over Time
The following a one graph showing the race of nominees (winners included) of Best Lead Actor over the years. We divided it into five graphs to accommodate all 100 years on the x-axis. We were able to find out that the number of people of color nominated for Oscars Best Actor and Best Supporting Actor has significantly increased over the years. The rate of the increase has accelerated towards recent years, and the diversity has also improved.